REPORT 2017
N-EXPO TOKYO REPORT
N-EXPO 2017 / Number & ratio of visitors by type
| |
Type |
Number |
% |
Sub-total |
% |
| 1 |
General Waste, Industrial Waste, Recycling Industry |
36,949 |
23.4% |
41,469 |
26.2% |
| 2 |
Environmental Preservation, Water, Soil, Atmosphere |
2,956 |
1.9% |
| 3 |
Demolition Work |
1,564 |
1.0% |
| 4 |
Environment-related Machinery, Equipment and Material Manufacturers |
10,386 |
6.6% |
32,006 |
20.2% |
| 5 |
Plant Suppliers |
5,232 |
3.3% |
| 6 |
Steel and Metal Industry |
3,249 |
2.1% |
| 7 |
Transport Equipment Related Industry |
1,771 |
1.1% |
| 8 |
Petrochemical Industry |
2,741 |
1.7% |
| 9 |
Equipment Sales and Trading |
8,627 |
5.5% |
| 10 |
Manufacture and Trading Business |
31,234 |
19.7% |
36,977 |
23.4% |
| 11 |
Tranportation and Warehousing Industry |
3,720 |
2.4% |
| 12 |
Hotels, Restaurants, Food Services and Comprehensive Services |
1,817 |
1.1% |
| 13 |
Medical Institution, Welfare Facilities |
206 |
0.1% |
| 14 |
Construction Industry |
16,525 |
10.4% |
24,601 |
15.6% |
| 15 |
Housing Industry, Real Estate |
1,124 |
0.7% |
| 16 |
Electric, Gas, Water Supply, Heat Supply |
2,070 |
1.3% |
| 17 |
Information and Communication Service |
1,939 |
1.2% |
| 18 |
Agriculture, Forestry, Fishery and Mining |
827 |
0.5% |
| 19 |
General Business Places |
2,116 |
1.3% |
| 20 |
Academic Experts |
928 |
0.6% |
12,046 |
7.6% |
| 21 |
Consultants |
5,478 |
3.5% |
| 22 |
Research Institutions, Intelligence Services |
1,627 |
1.0% |
| 23 |
General Citizens |
2,142 |
1.4% |
| 24 |
Students,etc |
1,871 |
1.2% |
| 25 |
National Diet Members and Local Assembly Members |
546 |
0.3% |
9,976 |
6.3% |
| 26 |
Central Government Offices |
469 |
0.3% |
| 27 |
Local Governments |
3,759 |
2.4% |
| 28 |
Other Related Organizations |
5,202 |
3.3% |
| 29 |
Press and Media Related |
1,122 |
0.7% |
1,122 |
0.7% |
| TOTAL |
158,197 |
100.0% |
158,197 |
100.0% |
N-EXPO 2017 / Number of exhibitor & booth by area
| Area |
Exhibitor |
Booth |
The ratio to
total exhibitors |
The ratio to
total booth |
| Waste Recycling / Waste Disposal / Demolition Area |
181 |
1,221 |
28.1% |
53.9% |
| Confidential Document / Security Measure Corner |
6 |
9 |
0.9% |
0.4% |
| Collection / Distribution / Transportation / Safekeeping / Physical Distribution Area |
28 |
239 |
4.3% |
10.5% |
| Biomass / Organic Waste Processing Area |
36 |
72 |
5.6% |
3.2% |
| Environmental Software / Scale / Measurement / Analysis Area |
31 |
44 |
4.8% |
1.9% |
| Bioplastic / Packaging / Eco-Products Area |
13 |
30 |
2.0% |
1.3% |
| Autonomy Area |
42 |
50 |
6.5% |
2.2% |
| Thermal Area |
29 |
109 |
4.5% |
4.8% |
| Civil Engineering / Construction / Disaster Countermeasure Corner |
13 |
55 |
2.0% |
2.4% |
| Water Treatment / Water Purification Area |
56 |
74 |
8.7% |
3.3% |
| Soil / Atmosphere / Environmental Improvement Area |
50 |
94 |
7.8% |
4.1% |
| Affiliate Organization / Academic Organization Area |
19 |
22 |
2.9% |
1.0% |
| N-EXPO Venture Corner |
11 |
12 |
1.7% |
0.5% |
| N-EXPO sub-total |
515 |
2,031 |
79.8% |
89.6% |
| GWPE Venture Corner |
16 |
19 |
2.5% |
0.8% |
| Power / Energy Saving Technology Area |
18 |
22 |
2.8% |
1.0% |
| Intense Heat Countermeasure Corner |
29 |
46 |
4.5% |
2.0% |
| Alternative Energy / Reproducing Energy Area |
63 |
124 |
9.8% |
5.5% |
| Global Warming Prevention Area |
4 |
25 |
0.6% |
1.1% |
| GWPE sub-total |
130 |
236 |
20.2% |
10.4% |
| Grand-total |
645 |
2,267 |
100.0% |
100.0% |
Questionnaire Surveys of Visitors
Over a period of four days from May 23 (Tue.) to 26 (Fri.), we carried out a survey of 250 visitors each day. Out
of the 1,000 surveys conducted over the four days, we received 949 responses (about 95%). Thank you for your
cooperation.
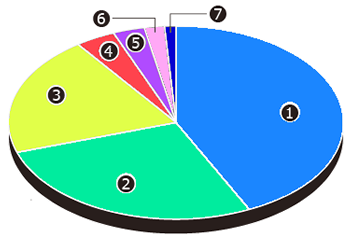
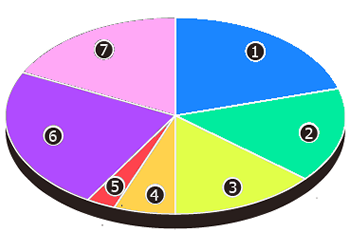
| How did you hear about this exhibition? |
|
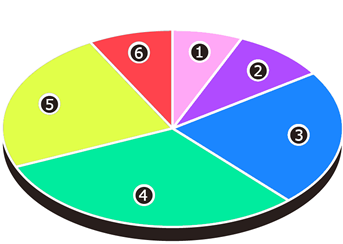
Age |
 |
|
 |
(1) Complimentary ticket from exhibitor .............. 43%
(2) Internet .............. 27%
(3) Complimentary ticket from organizers ............ 20%
(4) Transportation advertisement .............. 4%
(5) Other. .............. 3%
(6) Newspaper .............. 2%
(7) Magazine .............. 1% |
|
|
(1) 20-29 ........................... 7%
(2) 30-39 ........................... 9%
(3) 40-49 ........................... 23%
(4) 50-59 ........................... 31%
(5) 60-69 ........................... 24%
(6) Over 69 ......................... 8% |
|
| |
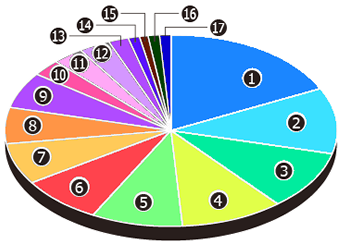
| In which area were you interested? |
|
Position |
 |
|
 |
(1) Waste Recycling / Waste Disposal / Demolition ......... 18%
(2) Water Treatment / Water Purification ........... 11%
(3) Power / Energy Saving Technology .............. 10%
(4) Global Warming Prevention ............... 10%
(5) Soil / Atmosphere / Environmental Improvement ......... 9%
(6) Intense Heat Countermeasure ............... 8%
(7) Alternative Energy / Reproducing Energy .................... 7%
(8) Biomass / Organic Waste Processing ......... 6%
(9) Collection / Distribution / Transportation / Safekeeping / Physical Distribution .............................................................. 6%
(10) Bioplastic / Packaging / Eco-Products ........ 3%
(11) Civll Engineering / Construction / Disaster Countermeasure ...... 3%
(12) Confidential Document / Security Measure ......... 3%
(13) Environmental Software / Scale / Measurement / Analysis, ....... 2%
(14) Autonomy ........................................................... 1%
(15) Affiliate Organization / Academic Organization ..................... 1%
(16) Thermal .............................................................. 1%
(17) Venture .............................................................. 1% |
|
|
(1) Management .......... 21%
(2) Director ................. 16%
(3) Manager ................ 14%
(4) Section Chief ............ 6%
(5) Chief ...................... 3%
(6) General staff ........... 24%
(7) Other .................... 18% |
|
Public Relations & Advertising Activities
We carried out the following PR and advertising activities of N-EXPO & GWPE in 2017
■Posters
Posters were sent to supporters and sponsors, exhibitors, prefectures and municipalities, clean centers, health centers, chambers of commerce, embassies and consulates, universities, high schools and colleges of technology, research institutes, and other businesses..
■Newspaper Advertisements
Ads were placed in Nikkan Kogyo Shimbun (PR planning), The Recycling Economy Times, The Hoso Times, and other newspapers.
■Magazine Advertisements
Ads were placed in Monthly the Waste, Bimonthly E-Contecture, Bimonthly Prevention of Global Warming, Sanpai Next, Monthly Food Packaging Japan, Monthly Carton & Box, and other magazines.
■Complimentary Tickets
Secretariat and exhibitors send complimentary tickets to addresses where posters were delivered and other places (Total tickets issued: 1.2 million)
■Transportation Advertisements
Ads were posted on all JR East lines in the Tokyo metropolitan area, Keihin Tohoku Line, Negishi Line, Saikyo Line (including the Rinkai Line), Chuo Line Rapid Service, Odakyu Line, Keio Line, Seibu Line, Tobu Tojo Line, all Tokyo Metro lines, Toei subway and Toei bus lines, JR West local and rapid trains, Osaka Municipal subway.
■Internet Advertisements
Ads were placed in various demand-side platforms (such as Logicad and MarketOne) and Google Display Network, Yahoo Display Network, Google AdWords, Yahoo Sponsored Search, and PR Times. Banner ads were placed on environmental-focus sites in Korea, Taiwan, China, and Hong Kong. Ads were also placed on the Nippo Internet and inserted in email transmissions.
■News Releases
News releases were sent to central government press clubs, newspaper companies, TV stations, radio stations, specialized trade magazines and papers, embassies, and consulates.
■Media Relations
<Television>
NHK, TBS TV, TV Tokyo, NIPPON TV, MX TV.
<Press>
Press attendance of 1,108 contacts from television and radio, internet, general newspapers and magazines, specialized newspapers and magazines, trade newspapers and magazines, other.